The Climate Charts Are Still Not Okay
Photo by Ayla Meinberg/Unsplash

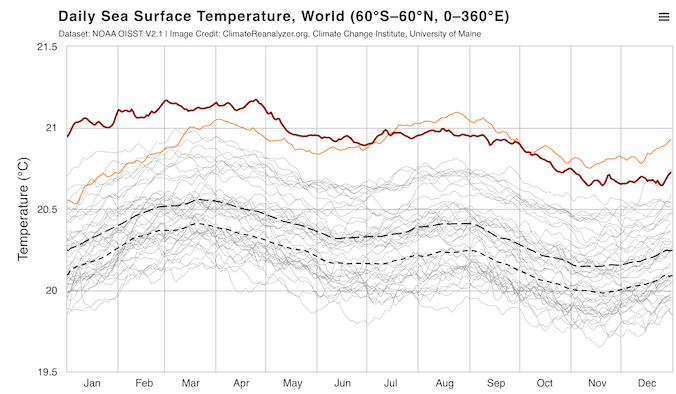
The first piece I wrote when I started at Splinter back in March was about a chart. A chart that I looked at every day, that had lodged itself in prominent corners of my brain in such a way as to render it constantly visible, omnipresent. At the time, it depicted a global average sea surface temperature, poles excluded, that so far exceeded that of previous years that it seemed like a mistake. To me, it took on an air of personification, climate change itself taken demonic form.
Not unsurprisingly, the line for 2024 did begin to find its way back to, if not the pack of years dating to 1981 when these records began, then at least to the previous leader. In mid-summer, it finally touched its nearest competitor — 2023, of course — and then dipped below it, where it has largely remained since. Again, this makes sense: the El Niño of the previous year had faded, taking its warming influence with it and landing us in a “La Niña Watch” phase, according to NOAA. Sprinkle in at least some degree of natural variation and sure, it makes sense that the world’s oceans wouldn’t just set a new record every day forever.
-

-
-
-
-
-
-
-
-
-
-
-
-
-
-
-
-
-
-
-
-
-
-
-
-
-
-
-
-
-
-
-
-
-
-
-
-
-
-
-
-
-
-
-
-
-
-
-
-
-
-
-
-
-
-
-
-
-
-
-
-
-
-
-
-
-
-
-
-
-
-
-
-
-
-
-
-
-
-
-
-
-
-
-
-
-
-
-
-
-
-
-
-
-
-
-
-
-
-
-
-
-
-
-
-
-
-
-