Why Bernie Sanders loves Jimmy Kimmel and Hillary Clinton loves Ellen

You’re channel-surfing and you catch yet another political ad. Ever wonder who the candidates are hoping to reach when they buy that airtime? Is it you?
We worked with the good folks at the Internet Archive, which has been capturing ads aired by candidates in major television markets, and with Nielsen, which tracks ratings and demographics, to help answer that question.
Below is each candidate’s favorite national show to advertise on, plus the makeup of that show’s audience.
Hillary Clinton
Favorite show: “The Ellen Degeneres Show”
Least favorite show: “CBS This Morning”
Most frequently run ad: https://archive.org/embed/PolAd_HillaryClinton_b665s
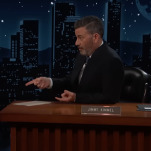
Bernie Sanders
Favorite show: “Jimmy Kimmel Live”
Least favorite show: “Wheel of Fortune”
Most frequently run ad: https://archive.org/embed/PolAd_BernieSanders_a80h0
Marco Rubio
Favorite show:”The Tonight Show Starring Jimmy Fallon”
Least favorite show: “Judge Judy”
Most frequently run ad: https://archive.org/embed/PolAd_MarcoRubio_s8ty9
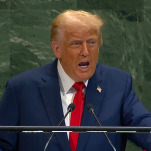
Donald Trump
Favorite show:”The Tonight Show Starring Jimmy Fallon”
Least favorite show: “Jeopardy”
Most frequently run ad: https://archive.org/embed/PolAd_DonaldTrump_bh0ap
John Kasich
Favorite show: “Jimmy Kimmel Live”
Least favorite show: “Family Feud”
Most frequently run ad: https://archive.org/embed/PolAd_JohnKasich_ej93x
Ted Cruz
Favorite show: “Jeopardy”
Least favorite show: “Family Feud”
Most frequently run ad: https://archive.org/embed/PolAd_TedCruz_jt0h4
-

-
-
-
-
-
-
-
-
-
-
-
-
-
-
-
-
-
-
-
-
-
-
-
-
-
-
-
-
-
-
-
-
-
-
-
-
-
-
-
-
-
-
-
-
-
-
-
-
-
-
-
-
-
-
-
-
-
-
-
-
-
-
-
-
-
-
-
-
-
-
-
-
-
-
-
-
-
-
-
-
-
-
-
-
-
-
-
-
-
-
-
-
-
-
-
-
-
-
-
-
-
-
-
-
-
-
-