I Agree with Nate Silver, the Pollsters Are Herding
Photo by Quinnnnnby, CC BY-SA 4.0
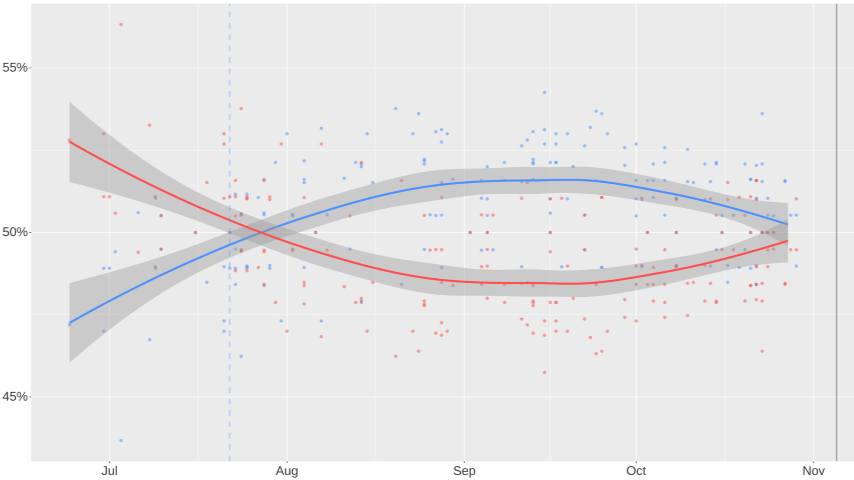
I looked at every single presidential election poll from North Carolina, Georgia, and Michigan in FiveThirtyEight‘s database since August 28th, and I think it is clear that something weird is going on with the polls. Every swing state has the same dynamic, where the vast majority of polls fall within an extremely narrow range around a tied race. I am not suggesting these races are not dead even, just that if they are, we should see far more variability in poll results than we are. It may be a true tossup election, but the story the polls are telling simply does not make sense to how sampling works. I am no Nate Silver fanboy, I have already proven at Splinter that I am loath to hand it to him, but I think his allegation here is correct.
There are too many polls in the swing states that show the race exactly Harris +1, TIE, Trump +1. Should be more variance than that. Everyone’s herding (or everyone but NYT/Siena).
— Nate Silver (@NateSilver538) October 29, 2024
It’s such a simple and obvious notion that ChatGPT can write accurate R code demonstrating the disconnect between expectations and reality. I told ChatGPT to write code assuming a political race is exactly even, and to simulate a sample of ten thousand polls with a random selection of a thousand respondents in each, and then to plot the distribution of polls along a histogram. This is what a natural sampling variation of a dead polling heat should produce (the magnitude of polling returns is less important to note than the overall shape this chart creates: a bell-curved normal distribution).
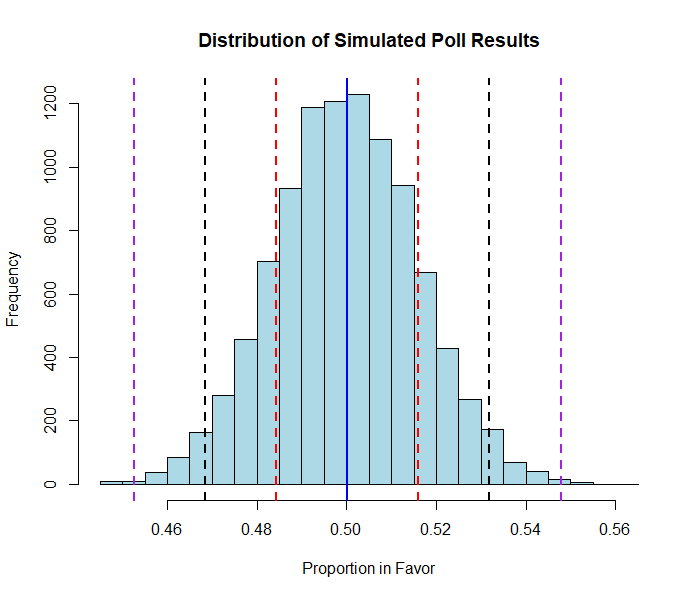
The vertical bars I added are for the 68-95-99.7 rule, which is an ironclad law that a little over two-thirds of all results in a normal distribution will fall within one standard deviation of the mean (the red bars), 95 percent will fall within two standard deviations of the mean (the black bars), and 99.7 percent will fall within three standard deviations of the mean (the purple bars). While it would take a lot more work than I am willing to do for this blog to calculate a true mean and standard deviation from these three hundred-plus polls from all three states I looked at, they cumulatively suggest a 50-50 race, which would place the mean at zero. While the regular three-point margin of error pollsters use for a sample of roughly one thousand will likely slightly overstate the standard deviation in their samples, it is still an accurate ballpark figure to use to approximate the standard deviation in their polling. It is not unreasonable to assume that roughly two-thirds of polls in every 50-50 state should fall between Trump +3 and Harris +3.
-

-
-
-
-
-
-
-
-
-
-
-
-
-
-
-
-
-
-
-
-
-
-
-
-
-
-
-
-
-
-
-
-
-
-
-
-
-
-
-
-
-
-
-
-
-
-
-
-
-
-
-
-
-
-
-
-
-
-
-
-
-
-
-
-
-
-
-
-
-
-
-
-
-
-
-
-
-
-
-
-
-
-
-
-
-
-
-
-
-
-
-
-
-
-
-
-
-
-
-
-
-
-
-
-
-
-
-