New Study Exposes America’s Economic Disconnect, and the Rich People Who Can Break the Economy
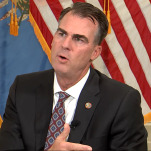
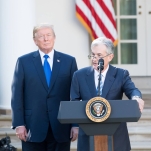
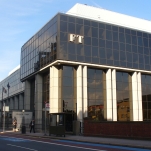
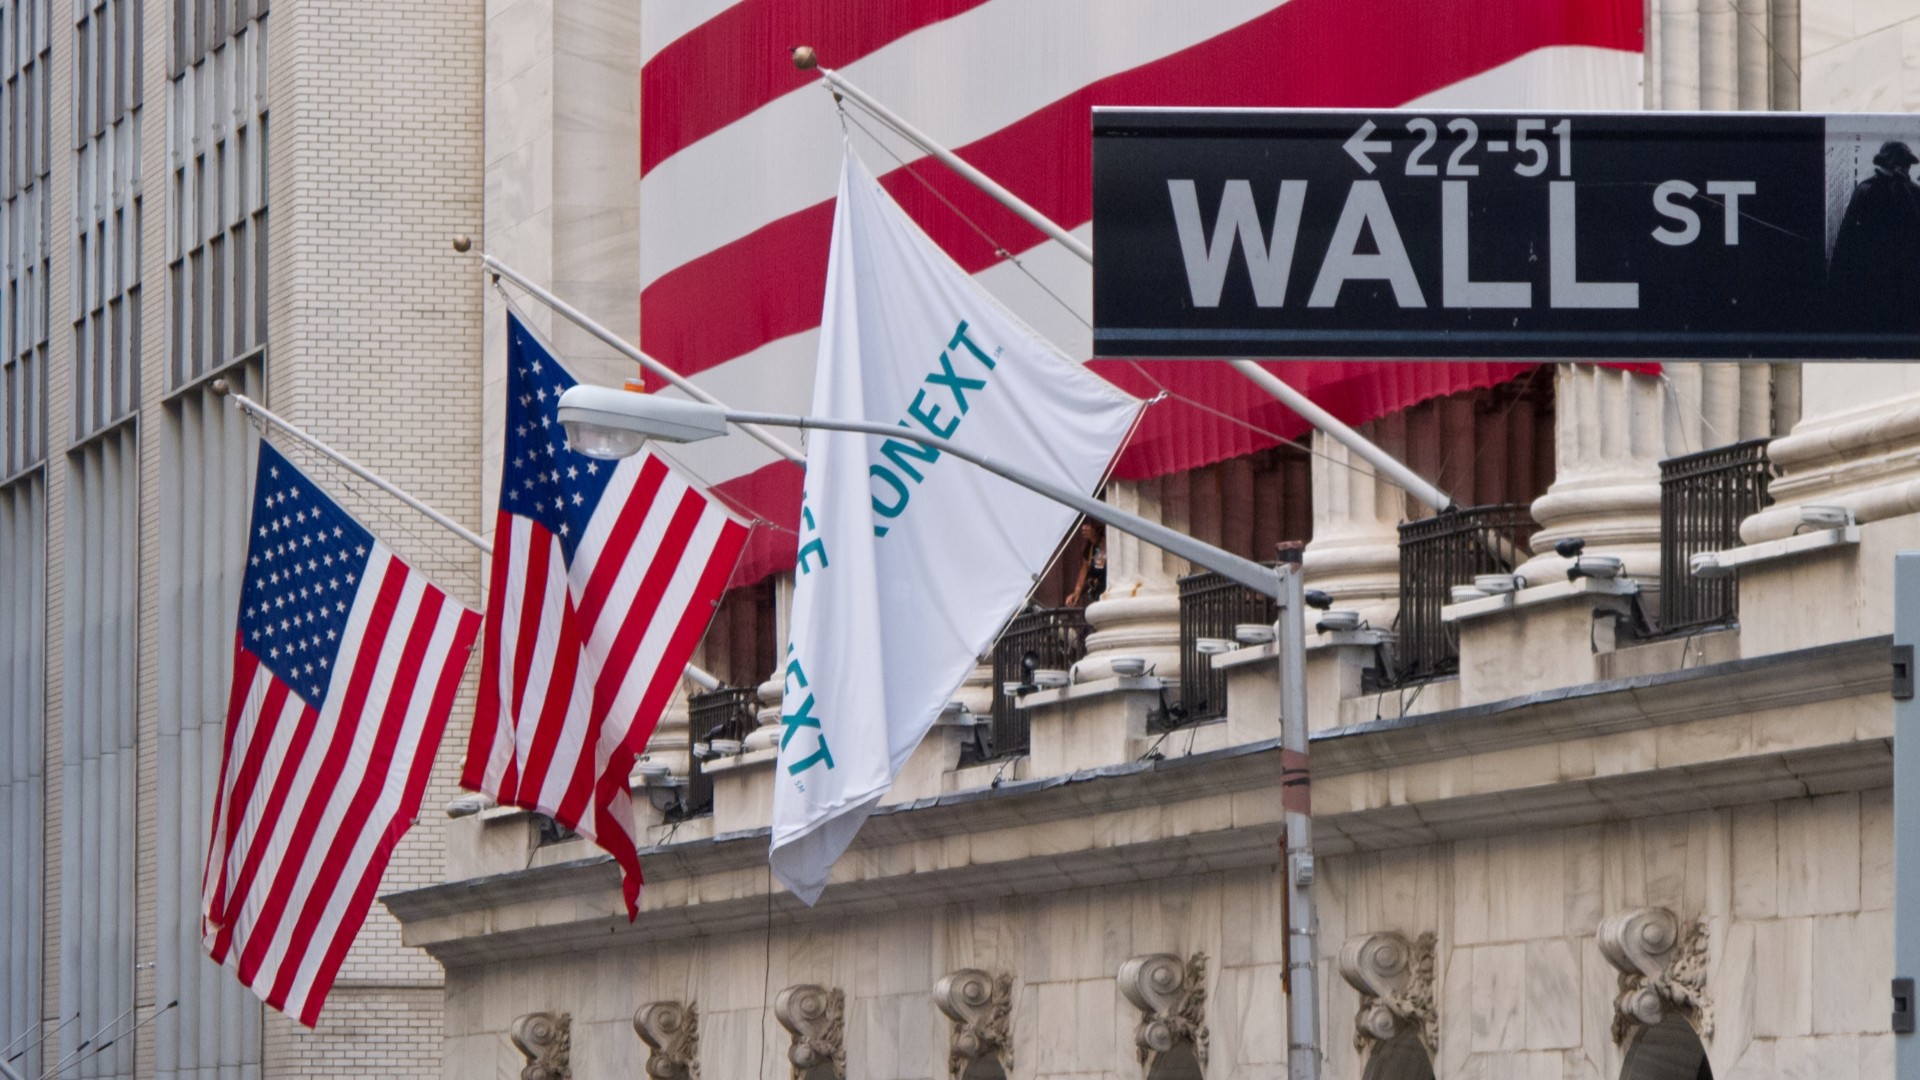
Photo by Carlos Delgado, CC BY-SA 3.0
I have focused a lot on the stock and bond markets since Trump’s election, in part because you write what you know and at this time last year I was getting my master’s in finance. But also, markets are forward-looking in nature and if you want a real sense of how Trump’s actions are being perceived by the world, you’re not going to find a more honest broker than financial markets who spend all day putting their money where their mouth is. To demonstrate just one example of many from markets currently uneasy about Trump, returns on the yield curve inverted the first week of his trade war, perhaps the clearest and most obvious warning that he is pursuing recessionary policies.
I have also focused heavily on the CAPE Ratio, also known as the Shiller P.E. ratio, as earnings are markets’ version of “ball don’t lie” and the price of the stock is the main focus of a company in our greedy capitalist world. Price to earnings ratios are helpful barometers of just how over- or undervalued current stocks and markets are relative to past ones. The Shiller P.E. Ratio smooths earnings over ten years to get an average that spans beyond one business cycle, providing an ultimate zoomed-out “ball don’t lie” metric for the market.
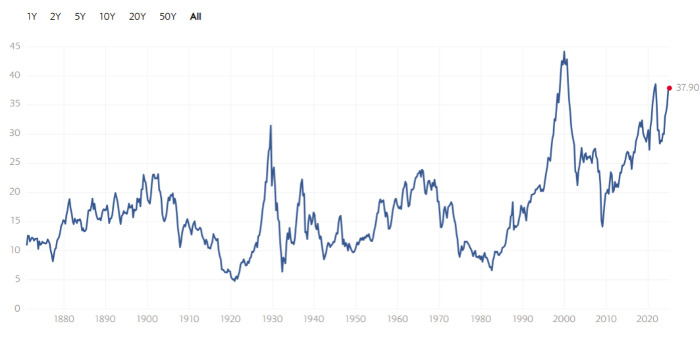
Chart by multpl. Data courtesy of Robert Shiller from his book, Irrational Exuberance.
An elevated ratio does not mean it must come all the way back down. The 2000 spike is qualitatively different from the 1930s, for good reason. Despite being the most over-valued market in history, the dot com bubble was real. It was a forward-looking market getting out ahead of a paradigm shifting technology where earnings inevitably caught up to deflating hysteria and brought it back to a new baseline elevated from the past. The 1930s bubble was driven by greed and fraud which is why it retraced all the way in a crisis that Elon Musk seems determine to speedrun.
AI is very important to our economy, even if it just is a bunch of hallucinating chatbots that Microsoft is now realizing don’t have as much demand as they invested for, and are canceling some data center leases as a result. The narrative is the point. The money has been spent and promised. The market is determined to repeat the 2000 pattern of a mega-bubble, and based on this ratio, you can prove these expectations are somewhat baked into the second or third most expensive market in history depending on which day you look at this chart. That means the market is fragile to a change in the prime narrative it has priced in, which, well…
This month’s recent stock market pullback is a result of Deepseek, the Chinese ChatGPT clone which proved that Nvidia and other chip makers’ “moats” they had helped construct around goliaths like Microsoft weren’t all so moat-y after all. As of this writing, Nvidia is down a little over twelve percent from its highs, and is being rejected by the previous range it sat in from November to January when the market was telling itself that Trump was going to be good for the market.
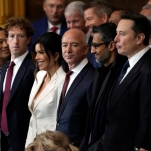
But given the divergence between Treasury Bonds and the Fed Funds Rate since September, it’s clear the smartest money in the world is calling bullshit and putting everyone else on edge. Smart money typically equals wealthy folks (a distinction Chris Rock so eloquently made clear when he said “Shaq is rich, the white man who signs his check is wealthy”), which brings us to an article today in the Wall Street Journal about new Moody’s Analytics data titled, “The U.S. Economy Depends More Than Ever on Rich People.”
-

-
-
-
-
-
-
-
-
-
-
-
-
-
-
-
-
-
-
-
-
-
-
-
-
-
-
-
-
-
-
-
-
-
-
-
-
-
-
-
-
-
-
-
-
-
-
-
-
-
-
-
-
-
-
-
-
-
-
-
-
-
-
-
-
-
-
-
-
-
-
-
-
-
-
-
-
-
-
-
-
-
-
-
-
-
-
-
-
-
-
-
-
-
-
-
-
-
-
-
-
-
-
-
-
-
-
-